
7. Methods and Examples: Marine Survey Techniques - Below the Seabed Surface and Geophysical Data#
The techniques covered in this section relate to imaging sediment layers and magnetic anomalies which may comprise ferrous material:
Magnetometer
Pinger and Chirps
Boomer and Sparker
Parametric (non-linear) Sub-bottom Echosounder
7.1. Magnetometer#
Magnetometer surveys are usually used in conjunction with other marine geophysical survey instruments such as side-scan sonar or multi-beam echosounder. A magnetometer measures the intensity of a magnetic field, with increased magnetization usually caused by the presence of ferrous (iron) or rocks containing magnetic minerals.
Scalar magnetometers (i.e. caesium vapour or Overhauser proton procession) are often the types used in marine archaeological surveys. Nanotesla or nT is used as the unit of record.
Instruments vary in their sensitivity and the rates at which they can sample and gather data (e.g. lightweight systems suitable for deploying from smaller vessels and available in 2024 include the SeaSPY2 which has a sensitive of up to 0.01nT and sampling range of 4Hz-0.1Hz, and the G-882 which can sample at up to 20 Hz.
The instrument is usually deployed at the end of a cable, some 2-2 ½ ship length distance behind the vessel, to minimise picking up the magnetic signature of the survey vessel itself.
The depth of water at which a magnetometer is flown depends on the size of magnetic anomalies that the magnetometer is expected to encounter. For example, a detectable mass of 4 – 10 tonnes of ferrous material may produce a magnetic signature of 10nT depending on the depth of the water column and the depth at which the towfish was flown. Hence surveys may be run with the magnetometer flown ‘shallow’ or ‘deep’ to achieve the best results.
The speed of the vessel is usually limited to 2.5 - 4 knots. The length of the towing cable needs to be known so that a layback calculation can be made to identify the location of the anomaly. Commonly used spacings for the survey lines or runlines appear to vary between 10 and 115m in East-West or North-South direction, with less frequent cross run-lines made at a 90-degree tangent (e.g. if surveying North to South, the cross run-lines will be East-West) (Camidge et al. 2015).
In practice, the smallest change in magnetic field that can be reliably detected and deemed likely to have archaeological significance is 3-5nT - depending on the amount of ‘noise’ recorded. A large magnetic anomaly, such as an iron or steel wreck, may be recorded with different strengths of magnetic signature on more than one of the parallel survey lines (i.e. same anomaly, but different strengths of magnetic signature depending on the distance away from the magnetometer).
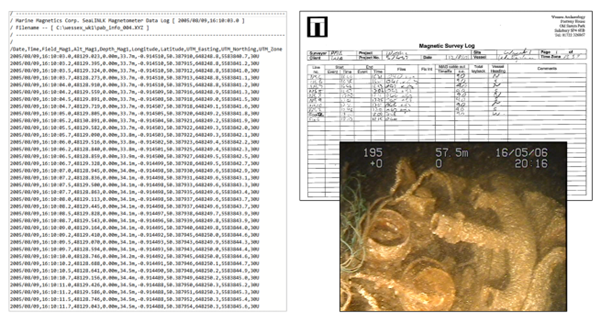
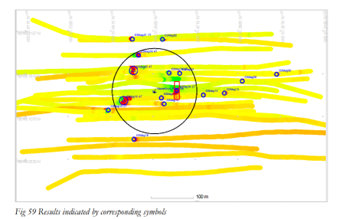
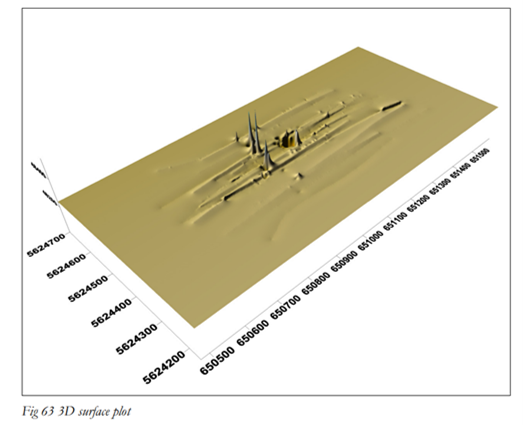
Fig. 7.1 The data shown above is typical of a magnetometer survey, this being produced by a Geoacoustics system, G881 caesium magnetometer EG. The log of the survey compiled onboard is also shown. The Wrecks on the Seabed Project undertaken by Wessex Archaeology from 2002-2006 includes this survey of B86 Liberator. The magnetometer data is archived by British Geological Survey. © Wessex Archaeology (British Geological Survey ref: BGS_CMD_REF653 and https://doi.org/10.5284/1017437)#
Case Study: Developing Magnetometer Techniques to Identify Submerged Archaeological Sites, Cornwall Council Historic Environment Projects
In March 2009 English Heritage commissioned Historic Environment Projects, Cornwall Council to carry out an initial theoretical study to inform field trials of different types of marine magnetometer in controlled conditions. Targets of different ferrous mass were surveyed, ranging from cannon shot to iron wrecks. The report has been archived with the ADS.
7.2. Sub-bottom profiling#
Sub-Bottom Profiling systems utilise an acoustic or seismic energy source, to trigger a pressure wave which travels down through the water column and into the seabed. The sediment layers of the seabed act as a minimum-phase filter which attenuates the high frequencies of the signal more than the low frequencies. A picture of the geology of the seabed can be obtained by recording the reflected returns of this sound from the seabed surface and geological layers of the subsurface using a pressure sensitive hydrophone array.
There are a variety of different sub-bottom profiling systems available, some transmitting very high frequencies capable of identifying small geological features in the shallow part of the seabed (less than 10m below seabed) and some transmitting lower frequencies capable of identifying deeper geology and features (large features at 100m or more) but with a trade-off in ‘resolution’. The difference between systems relates to ways of generating pulses and the types of pulses emitted – e.g. FM sweep, continuous wave, or Ricker pulse.
Sub-bottom profiling systems include Pinger, Chirp, Boomer, Sparker, and Non-Linear Parametric Sub-bottom profilers (Gron and Missiaen 2013).
Chirps and Boomer are the systems most used by archaeologists in the UK in recent years to gather information about buried wreck sites and deposits which have the potential to contain evidence of palaeolandscapes (e.g. peat horizons). They comprise a source which generates the seismic pulse and a single hydrophone or a multiple array for detecting the seismic reflections.
Typical processing of sub-bottom profiling data consists of:
Bottom tracking with conversion to a seabed reflector;
Heave correction (application of a swell filter);
Application of simple gain functions for image enhancement (e.g., Automatic Gain Control or Time Varying Gain);
Muting of water column returns (based on tracked seabed level);
Block averaging of traces to reduce some high frequency noise (also referred to as stacking);
Data transformation to treat skewed frequency-amplitude distribution.
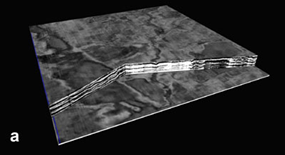
In recent years, through close line-spacing and using interpolation techniques, pseudo-3D images of the sub-bottom seabed have been able to be constructed. Chirps and parametric sub-bottom profilers were tested in this way for the submerged Prehistoric Archaeology and Landscapes of the Continental Shelf research project (Methods and Techniques).
This method also facilitated the creation of seismic data cubes illustrating the chronostratigraphic relationships between Holocene and earlier features for the North Sea (Finch et al. 1997; Gaffney et al. 2007; Van Heteren et al. 2014).
Another development is the application of acoustic impedance inversion to very high resolution marine seismic reflection data, which showed strong correlation with seabed samples and thus has the potential to reduce the need for extensive and expensive coring (Vardy 2015).
7.3. Pinger and Chirps#
Pinger systems produce the highest-frequency system acoustic pulses (operating between 2 and 20 kHz) using a ceramic transducer. These can produce high-resolution images capable of resolving small features, however they cannot penetrate very deeply into the seabed. They can operate in water as shallow as 4m and are often mounted on a pole on the side of a vessel to be submerged. They may have interchangeable frequency range sound channels (e.g. low frequency at 3.5kHz for hard-packed sands, 15kHz for soft mud sediments, and a 200kHz to establish the surface of the seabed). These have been largely replaced by Chirp and Parametric systems
Chirp sub-bottom profiling systems are another high-frequency system, which has been successfully used in archaeology to investigate the uppermost 30-40m of the seabed, especially where the deposits are poorly consolidated. Chirps produce a long (low frequency) pulse, made up of multiple higher frequency waveforms. In archaeological investigations, the buried wooden shipwrecks and wall ruins are normally located under a few decimetres of soft sediment and muds. The acquisition and processing software can apply algorithms, such as gain functions or filters, particularly to aid interpretation in the uppermost metres of sediment (Quinn et al. 2010; Baradello 2014; Winton 2023). Chirp systems are usually towed behind the vessel.
Often systems can record as ASCII, Binary, and SEG_Y, but the preferred file format for archiving is .seg-y.
7.4. Boomer and Sparker Systems#
These are lower-frequency systems (dominant frequencies between 500 Hz and 5 kHz) capable of penetrating much further beneath the seafloor (up to 100m) with an accuracy resolution of 10-15cm. Both types of system are usually towed behind the vessel with a hydrophone.
A Boomer system uses an induction coil and metal plate to produce the acoustic pulse electromagnetically. An electric charge is generated in a capacitor bank and then discharged through one or more spiral coils, which causes one or more copper or aluminium plates adjacent to the coils to flex away from the coil. This flexing produces the acoustic shock wave. System can be made up of single or triple plates, with triple plate systems capable of penetrating to water depths of 1000m.
The same deep water acquisition properties are capable from Sparker systems. These work by producing an electrical spark, which vaporises the sea water around the tip of the Sparker array. The vaporised water rapidly expands producing a pressure wave. Large, very high-powered (~12,000kJ) Sparkers can produce lower frequencies (down to 50Hz) and hence can penetrate to water depths of 1000m. The software used to acquire data may use proprietary file formats but the preferred format for archiving is .seg-y.
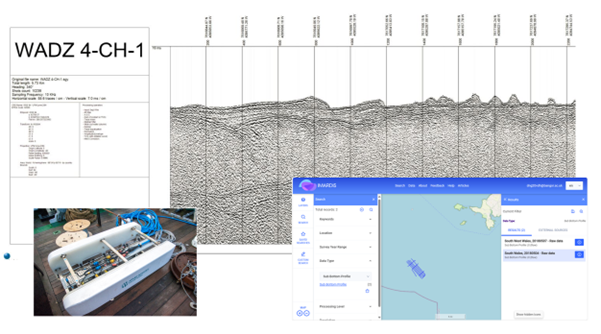
Fig. 7.2 Sample of data from an Applied Acoustics S-Boomer gathered during a sub-bottom profiling survey undertaken off West Wales © Bangor University (Bangor University Sub Bottom Profile data, South Wales 20180504 - Raw data (imardis.org) imardis:metadata:e722d125-d59b-47b3-8706-3d510177ad1e).#
Case Study: Seabed Prehistory, Gauging the Effects of Marine Aggregates Dredging, Volume II Arun, Wessex Archaeology
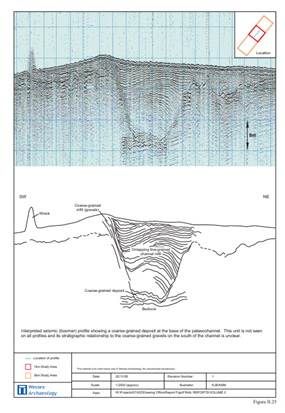
The study area for this phase of the project was the Palaeo-Arun, an area approximately 18km south of Littlehampton, off the coast of West Sussex in the English Channel. Survey work took place from 1st to 18th July 2003 and 27th to 29th September 2003. During which twenty vibrocores, 108 seabed grab samples and 245km of seismic survey data were collected over a 3.5km by 1km area, Three different seismic systems were used - a boomer, a pinger and a chirp. A comparison of the three data sets showed that the boomer system gave the deepest penetration (approximately 30m) into the geology of the study area with sufficient resolution to interpret a buried palaeochannel feature. The reports from the project are archived with Archaeology Data Service.
Case Study: West Coast Palaeolandscapes Project (Lost Lands of our Ancestors)
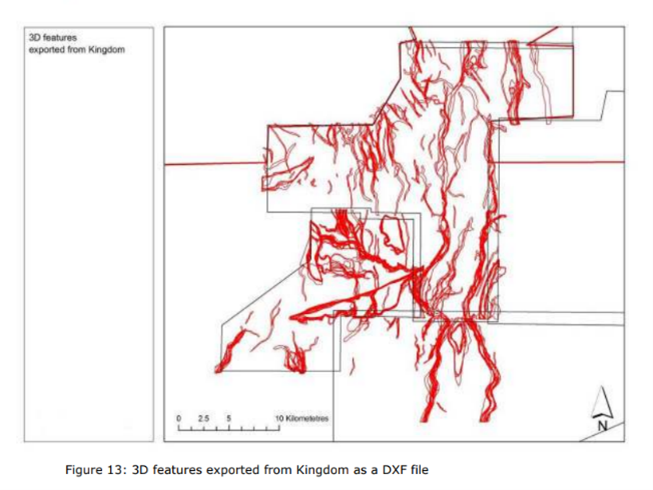
The West Coast Palaeolandscapes Project (Lost Lands of our Ancestors) identified that there were several areas around the Welsh Coast that had 2D and 3D seismic data gathered by the oil and gas industries. The information contained therein has significant potential to increase our understanding of the submerged Palaeolithic and Mesolithic landscapes around the coast of England and Wales. Several features of landscape significance were identified and recorded with the study areas. The GIS mapping generated by the mapping of these features and the report by University of Birmingham archived with Royal Commission on the Ancient and Historical Monuments of Wales. The pilot and main datasets are also archived by the ADS.
7.5. Parametric (non-linear) Sub-bottom Echosounder#
The use of Boomer systems has reduced in recent years to be replaced by Parametric sub-bottom profilers or sediment echosounders. These systems are very compact and exploit signal interference process to create a low frequency signal with a very narrow beam width +/- 2° (equating to around 7% of the water depth). The two high frequency signals, 100-95 hz at high pressure, will propagate in a non-linear – the higher sound frequencies will move faster than the lower. Therefore, secondary frequencies are produced, such as harmonics, sums, and differences of the emitted signal (Saleh and Rabah 2016). The main benefit is higher resolution and accuracy of depth measurement. Depending on the lithography of the substrate, they may be able to penetrate between 2-20m into the sediment.
Systems are usually mounted on the hull of the survey vessel, but the instrument can operate in very shallow water (2m) and to depths of 500m. The acquisition software may be proprietary, and processing allows export to SEG-Y, Extended Triton format (.xtf) and to ASCII formats.
Navigational corrected data and interpreted results to be deposited with the British Geological Survey with the appropriate Metadata record completed.