
6. Methods and Examples: Marine Survey Techniques - Sea Surface to the Seabed#
The techniques covered in this section relate to bathymetric survey and imaging the surface of the seabed:
Imagery – digital photographs and video
Photomosaics and Photogrammetry
Bathymetric LiDAR
Underwater Laser Scanners
Side-scan sonar
Single and multi-beam echosounders
Oceanographic Data Loggers
6.1. Imagery - Digital Photographs and Video#
Whether for exploration to establish the condition of a site, for the establishment of comparable views for monitoring purposes, or as a record of work undertaken for publication, The gathering of underwater imagery is a fundamental technique for underwater archaeologists.
Imagery might be gathered by Remotely Operated Vehicles (ROV), Automated Underwater Vehicles AUV) or divers. For example, helmet mounted cameras can form an extremely useful adjunct to a diver’s vision. They also provide a record of the dive for Health and Safety purposes. When combined with diver tracking systems, a highly effective means of ground truthing anomalies is the result. Audio commentary captured alongside video can also provide valuable supporting documentation.
Several manufacturers now produce lightweight devices which are easy to handle, capable of performing in extreme conditions, and more importantly can provide both still images and video in high resolution.
As discussed in detail in the ADS Guides on Digital Images and Digital Video, cameras often default to the manufacturer’s proprietary file format. Suitable formats may need to be set at the time of capture or the files subsequently converted to formats more appropriate for long term digital preservation. Consideration should also be given to the file size of each image and of the final product, particularly regarding the storage required and speed of loading for end users.
Case Study: Stirling Castle Archive Assessment
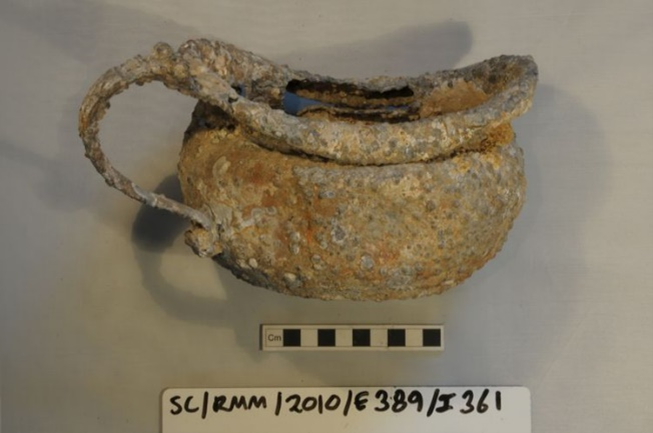

The Stirling Castle was a 70-gun 3rd-rate ship-of-the-line, built in Deptford in 1679, and lost on the Goodwin Sands during the Great Storm of 1703. Numerous individuals, groups, Trusts and organisations have been involved in investigating this Designated Historic Shipwreck since its first discovery in 1979. Work on the archive generated between 1979-2009 has led to the production of a monograph, and access to the archive database and artefact images. The collection contains metadata describing the database and its structure, a database entity relationship diagram, plus 472 object images (a small chamber pot is shown image ref 361c.jpg) and is available from the ADS here: Stirling Castle Archive Assessment: Introduction
Case Study: Mystery Wreck Project (Flower of Ugie), Hampshire and Wight Trust for Maritime Archaeology, 2012
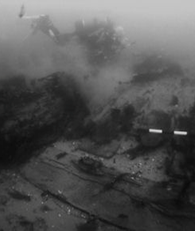
In 2004, archaeological diving work by HWTMA began on a shipwreck site in the Eastern Solent following a report from a fisherman of a net snag on a previously unknown obstruction. Surveys between 2004 and 2008 revealed the remains of a wooden shipwreck, lying in two large pieces with an additional area of dispersed remains. The site has been identified as the Flower of Ugie, a sailing barque built in Sunderland in 1838 which was wrecked on the Horse Tail Sand in the Eastern Solent on 27th December 1852. The archive includes digital photographs, finds drawings, site plan, dendrochronology results and a .pdf of the final report, and is available from the ADS here: Mystery Wreck Project (Flower of Ugie).
6.2. Photogrammetry and Photomosaics#
As with terrestrial archaeology, the creation of 3D photogrammetric models and 2D photomosaics from sets of still images is increasingly used for the recording of submerged sites, particularly where the seabed is flat and where a site has few upstanding elements. Recent advances in computer visualisation and processing capabilities have enabled archaeologists to automate fast and geometrically accurate three-dimensional photogrammetric visualisations using ‘Structure from Motion’ (SfM). This largely automated process, working from sets of overlapping (60-80%) still images, detects and matches elements across images, reconstructing 3D coordinates and camera positions. From such data sets, software such as Metashape or RealityCapture can generate various digital products including point clouds, 3D meshes, digital elevation models (DEMs) and orthophotos (Yamafune et al. 2017). Exported to other software such as CloudCompare, point clouds can also provide opportunities to identify height differences between different surveys (e.g. changes to scouring patterns).
Previously the creation of orthophotos from image sets often involved the laborious setting up of accurate grids, the positioning of reference targets, and the use of rigid bipod frames or towers to ensure pictures could be taken from a constant height and that the photomosaic plane stayed horizontal. Other applications of the same basic principles include stereovision (dual camera) rigs used by divers and systems designed for deployment with AUV, the latter programmed to follow a fixed survey pattern at a set height and then sent on their way to cover larger areas (Henderson et al. 2013). The theory and methods of photogrammetry are described in greater detail in the Historic England guide Photogrammetric Applications for Cultural Heritage (2017), with Case Study 6 looking specifically at marine examples. Equally, McCarthy et al (2019, 3-4) provide a detailed description of both the development of photogrammetric techniques in maritime archaeology alongside a discussion of terminology.
While software and technology have seen significant improvements over the last twenty years a number of issues remain relevant to the creation of photogrammetric models and orthophotos. Problems of geometrical accuracy within single images and over multiple images covering larger areas have been highlighted, as have problems with optical distortion through the water, camera tilt, and variations in topography (Henderson et al. 2013). It is important to calibrate cameras to counter the effects of refraction through the air, housing, and water interfaces and recording information about this calibration process is an important part of the project metadata. Additionally, colour and brightness adjustments in the processing stage may be needed to improve the overall look of the final product and may need to be considered as preservation intervention points (see previous section) or key points for documentation.
Importantly, a system of control points/datums is usually needed to check spatial accuracy and such points should be documented and included within the digital archive. Trilateration through inputting measurements gathered by divers into software such as Site Recorder might be used to ensure that a photomosaic can be geometrically corrected or ‘orthorectified’ to measure true distances. Indeed, the accuracy of these types of surveys has seen wide adoption to replace diver measured surveys. For example, an AUV with the capacity to take 5 images per second at a resolution of 4MB per image was used by the Black Sea Map project from 2015-2018. It is anticipated that photogrammetric techniques and software will continue to develop and be a major part of underwater archaeological surveys into the future.
Case Study: Swan, Duart Point, Dr Colin Martin and Paul Martin
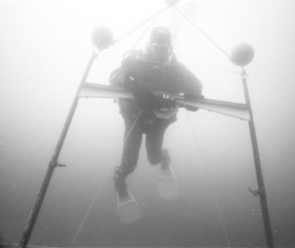
The free-standing camera-tower designed to prepare photo-mosaics on the Duart Point wreck in 1992. This image is part of the extensive collections deposited by Dr Colin and Paula Martin (some 1200 images). The Swan collection includes site plans, sections, underwater video, photographs, object photographs and illustrations, and photographs of the team. It is archived with Historic Environment Scotland here: Swan, Duart Point
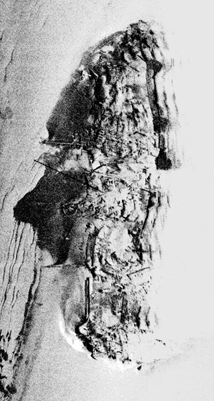
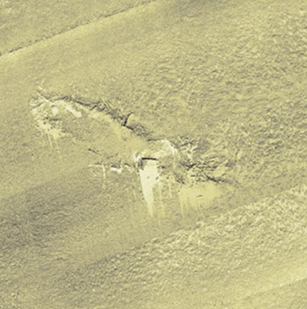
Case Study: HMS Colossus and the Wheel Wreck, CISMAS
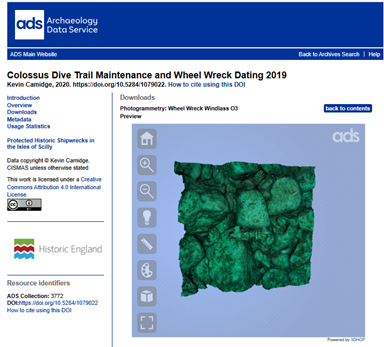
The collections associated with the maintenance of the HMS Colossus and Wheel Wreck on the Isles of Scilly include 3D photogrammetric models of artefacts and a section of seabed from the Wheel Wreck containing the windlass. The data is archived with the Archaeology Data Service here: Colossus Dive Trail Maintenance and Wheel Wreck Dating 2019.
6.3. Bathymetric LiDAR#
The use of airborne LiDAR systems undertaking bathymetric surveys can provide seamless, contiguous coverage between land and sea making them an effective and cost-effective technology for the creation of detailed 3D elevation models of coastlines. Such systems employ a blue-green higher wave-length laser beam to penetrate the surface of the water and reflect off the seabed and a lower frequency infrared pulse which is reflected off the sea surface. With good water clarity, shallow water systems can map up to 10m and deep-water systems to around 25-30m in ideal conditions. The software used to visualise, edit, control quality and extract end products includes algorithms which can analyse the raw waveform data to undertake substrate characterisation and vegetation analysis. Airborne LiDAR bathymetry allows topographic and bathymetric data to be seamlessly integrated but does not yet provide the point density needed for detailed inspections and 3D modelling of underwater sites. This is due to the way that the laser beam is spread meaning that it is not able to detect small features. Too much wind makes white water, waves, and noisy data, while algae floating on the surface blocks the laser and fine sand stirred up from the seabed also interferes with data collections. Uses are deployments where surface vessels cannot operate efficiently and safely, and the focus of the survey may be the evolution of a coastline and offshore banks in relation to a coastal site.
Systems output in point clouds (.las; .csv; .xlsx) using the same file formats as terrestrial LiDAR. The raw data can be used to create digital elevation models and bathymetric contour maps.
The UK Hydrographic Office has published a survey specification for contractors which also includes information about acquisition, processing and file-naming conventions (UKHO 2020b)
6.4. Underwater Laser#
Underwater laser scanners have been used to detect and record marine archaeological sites with high-precision and resolution without the need for lengthy processing time. Underwater lasers operate in the blue-green region of the light spectrum (420: 570nm) sweeping a laser line across the target at a 50-degree angle with the backscatter captured by a Charge-Couple Device (CCD) camera mounted at a reciprocal angle. The precise location of the surface reflecting the laser beam is then triangulated by the system, with 3D point clouds rendered in real-time for viewing and assessment by the acquisition software.
Deployment methods include stationary scanning done by a rotary actuator or mounted on ROV, UAV or Skid with positioning systems. Such ROV/UAV/Skid mountings often include the facility to vary the pitch of the laser to suit the site - forward/downward projection for vertical surfaces and straight downward for flat surfaces. A still image or video camera and light source may complete the common survey instrumentation deployed on the RIV/UAV/Skid but mounted in such a way to mitigate the illumination of matter suspended in the water.
Turbid water can dramatically reduce the laser range because particles attenuate the laser’s backscattered signal. Different short, mid, and long-range laser systems are available, operating at ranges of .0.1m – 1m, 0.25m to 2.5m and 1m – 9m. Hence the use of these laser survey underwater relies on being able to approach closely with the laser.
Recent development includes mounting multiple laser systems on a single ROV, output images in colour and monochrome, image enhancement and machine-learning colour correction.
The data gathered for laser surveys will comprise point clouds composed of millions of three-dimensional co-ordinates (.xyz) accompanied by positional information, and most likely digital stills/video.
6.5. Side-Scan Sonar#
Side-scan sonar equipment can be ship-borne but those most used in archaeology are towed systems. They produce high resolution imagery at a comparatively lower cost for the equipment. Side-scan sonars emit a wide-angled conical- or fan-shaped acoustic pulse downwards to the seafloor. The sonar’s left and right transducers sonify or illuminate trapezoid-shaped areas of the seabed on the left and right sides of the direction of travel. The transducers switch between emitting and receiving pulse signals.
Hard, rough seabed produces a strong pulse return signal, whilst soft and flat seabed generate weaker return signals. Return signals are not received from areas of seabed blocked by protruding anomalies – from these acoustic ‘shadows’ the shape, height and dimension of the anomaly can be determined.
The dark band in the centre of the two-dimensional image produced represents the zone that is unreachable by the signals produced by the left and right transducers - that is, directly beneath the towfish. The width and uniformity of the dark band provides information about the track line (centre line of the image), in relation to water depth.
The range of the survey (width of sonified seabed to left and right) is determined by the pulse frequencies - a lower frequency (50 kilohertz (kHz) -100 kHz) can cover large swathes of the seabed at low image resolution, whilst higher-frequency pulses (500 kHz to 1 megahertz) record smaller areas but in much greater detail.
Side-scan sonar is particularly useful for identifying micro-topography. However, it does not provide accurate bathymetry, so it is often used in tandem with single-beam and multibeam sonar to create a more comprehensive map of the seafloor.
Navigationally corrected data from single and multi-beam echosounders should be submitted to the collections of the British Geological Survey to allow for the updating of information about the surface of the seabed.
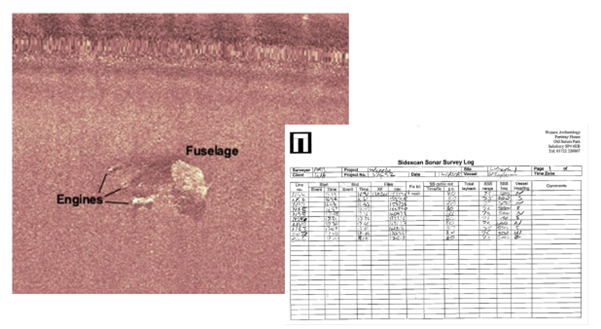
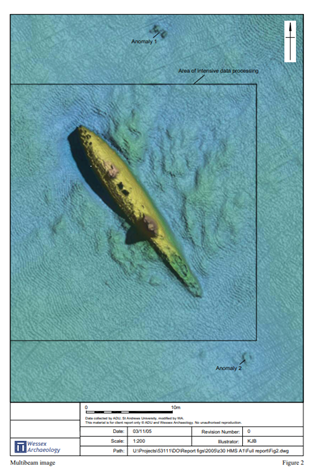
Fig. 6.1 The Wrecks on the Seabed Project undertaken by Wessex Archaeology from 2002-2006 includes this side-scan sonar survey of a B86 Liberator. The towfish was an EG&G system running at 500Khz linked to a Leica differential Global Positioning System with Trimble HydroPro V2.11 navigation software. The survey log compiled onboard is also shown. The data is archived by British Geological Survey. © Wessex Archaeology (British Geological Survey ref: BGS_CMD_REF653 and https://doi.org/10.5284/1017437)#
Case Study: HMS Campania, Designated Historic Wreck Site Assessment, Wessex Archaeology
This side-scan sonar image was acquired using a Klein 3000 digital side-scan sonar system in 2004. The Campania was a Cunard Liner completed in 1892. The vessel was purchased by the Admiralty in the Great War to operate as a Merchant Cruiser and sea-plane carrier. The ship was sunk in a collision with another ship in the Firth of Forth on the 5th November 1918 and is designated as a Marine Protected Area. An archaeological survey was carried out by Wessex Archaeology in 2004 on behalf of Historic Scotland (now Historic Environment Scotland) using a Klein 3000 side scan sonar. It was ascertained that, despite the extensive salvage operations, the vessel survived in good condition and features such as the main mast, flight deck and ship’s cranes were identified. The side-scan data and reports are archived with Historic Environment Scotland.
Case Study: ‘The Diamond, Designated Historic Wreck Site Assessment, Wessex Archaeology and Cotswold Archaeology
This side-scan sonar survey of ‘The Diamond’, one of the Welsh Designated Historic Wrecks, was carried out in 2007 by Wessex Archaeology on behalf of Cadw as part of ongoing site monitoring. Side-scan sonar data was gathered by both Wessex Archaeology and Cotswold Archaeology as part of on-going monitoring. The site is now believed to be the full-rigged ship, the Danube, built at Quebec in 1854 and lost on Sarn Badrig on 6 March 1861.
The reports of the surveys have been archived with the Royal Commission on the Ancient and Historical Monuments of Wales.
6.6. Single-Beam Echosounders#
Single-beam echosounders have been around for over 60 years. They measure the depth to the seabed by recording the time a sound pulse takes to travel from the transducer to the seabed and back. The pulses of sound are transmitted vertically downwards.
The transducers also act as the receiver, and it produces a narrow beam (typically between 2-5 degrees in width) to create a small circular footprint. The system uses the mean speed of sound through water to make the calculation of depth (i.e. through water time, usually between 1480ms and 1500ms, multiplied by 2 to represent the signal reaching the seabed and returning = depth).
Single-beam echosounders still have applications in archaeology. For example, a system might be used to identify or re-find a site for diving inspection and to gather simple profiles along the length or breadth to assist in identification. Area surveys are usually conducted using parallel lines or tracks at a set spacing.
The transducer is normally mounted on the hull of vessels and the results will need to be corrected for the roll, pitch, and heave of the vessel. The bathymetric data produced is in its most basic form, consisting of data points that have XYZ co-ordinates. The X and Y being the position (e.g. latitude and longitude), and Z being the depth. To account for the tide, depth measurements are normally reduced to a common reference level such as mean sea-level (MSL) or lowest astronomical tide (LAT).
6.7. Multi-beam echosounder#
Multi-beam echosounders use multiple beams at different angles to extend the amount of seabed mapped on each pass. The pulses of sound emitted form into a fan, known as a swath, which is narrow along track (fore/aft), but wide across the track of the vessel (port/starboard). Each pulse can generate hundreds of depth measurements and full seabed coverage can be ensured by overlapping the swathe width on the parallel line of survey by 140-150%. Optimal high-definition 3D imaging is achieved through maximising the pulse rate, narrowing the angular sector, using the highest frequency and shortest pulse lengths, applied to at least 3-5 overlapping centre-line-parallel and offset passes with additional perpendicular/oblique lines. This should facilitate obtaining high density data on both horizontal and vertical surfaces. This methodology is different from traditional survey methods employed to optimise information about the shape and textures of the seafloor (Westley et al 2019).
The information obtained from multi-beam echosounders includes not only depth from the reflection acoustic waves, but also scattering values from sound signals reflected from the seabed called backscatter. Instead of ground-truthing the nature of the sediment by grab sampling or seabed video images, analysis of backscatter has been used to predict sediment and habitat types. For example, backscatter value for clay sediment may range from -33.81 to -28 dB; clayey silt sediment from -27.99 to -23 dB; sandy silt from -22.99 to -18 dB; and sand from 17.99 to - 10 dB (Nitriansyah and Cahyono 2022).
The preferred format for archiving is Extended Triton format (.xtf). The UKHO has published a survey specification for contractors, which also provides guidance for gathering, processing, and for file-naming conventions (UKHO 2018). Navigationally corrected data from multi-beam echosounders should be deposited with the UK Hydrographic Office to allow the updating of charts. Information interpreted from the back scatter can also be submitted to the British Geological Survey to allow for the updating of seabed sediment mapping.

Fig. 6.2 Output of data from Reson 7125 dual frequency (200 kHz and 400 kHz) SeaBat Multi-beam system for HMSM H5 in Cardigan Bay saved to .csv © IMARDIS Bangor University#
Case Study: U-Boat Project 1914-18
This project was a collaboration between the Royal Commission on the Ancient and Historical Monuments of Wales, Bangor University, and the Nautical Archaeology Society. High resolution multibeam data, as well as underwater video footage showing the ecology and biodiversity of the wreck sites was gathered. The multi-beam data is available from the IMARDIS portal.
The 3D models and multibeam data are archived with the Royal Commission on the Ancient and Historical Monuments of Wales.
Case Study: HM submarine A1, Designated Historic Wreck Site Assessment, Wessex Archaeology
A magnetometer survey, a sub bottom profiler survey and a multibeam echosounder survey of the wreck site were undertaken in 2003 and 2005.
The reports of the survey are archived with the Archaeology Data Service, whilst the geophysical survey data is archived through the MEDIN Data Archive Centres (British Geological Survey and United Kingdom Hydrographic Office).
6.8. Oceanographic Data Loggers#
Physical processes are dominant in the initial phases of site formations with scouring and associated depositional patterns forming in response to hydrodynamic forcing, changes to wave climates, increases in flow velocity and turbulence intensity around the structure that remains above the level of the seabed. Hence site monitoring has involved the use of loggers to record wave heights, tidal flows, and currents through diurnal and seasonal cycles. For example, tidal stream data can be gathered by an ADCP (acoustic doppler current profiler).
Chemical and biological processes continue to contribute to site formation. For example, the part of a shipwreck exposed above the seabed is progressively colonised by a variety of biological organisms (a process known as marine fouling). Each species is likely to occupy a specific niche, where environmental parameters and the availability of nutrients will determine rates of growth and reproduction rates. Environmental parameters include depth, pressure, tidal stream, salinity, temperature, dissolved oxygen, partial pressure of carbon dioxide, acidity, conductivity, turbidity, and nitrate concentrations.
A combination of such sensors, depending on what has been determined as being of most interest to a particular site, are often integrated into one instrument pack and secured in position by mooring lines systems, weighed frames resting on the seabed, floating buoys, or ROVs and AUVs.
The sensors can include autonomous communication relaying results to Cloud storage or shore stations or the data is recorded then recovered with the instrument at the end the deployment period.
Most instruments systems are supplied with user interfaces which facilitate real-time visualisation and customisable exports. Output files are most frequently made available as .txt, .csv. and NetCDF (.nc). These are formats also suitable for archiving.
These data sets have a wider interest than purely for archaeological purposes, and MEDIN DAC to which these data sets should be copied is BODC.
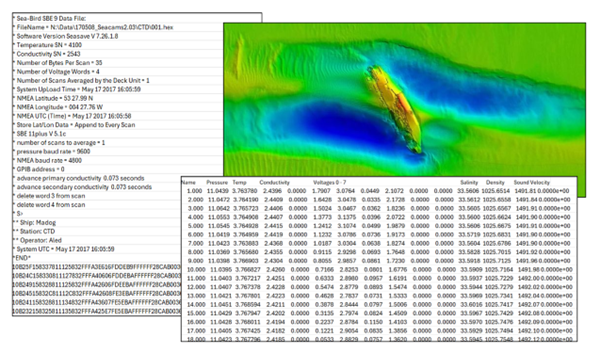
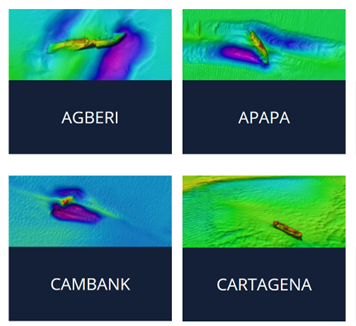
Fig. 6.3 Data acquired from Seabird SBE 911plus CTD with SBE32 water sampler deployed using a hydrographic winch aboard the Research Vessel Prince Madog in the vicinity to the wreck of the Apapa off North Anglesey (.hex file). The instrument recorded pressure, temperature, electrical conductivity, salinity, density, and sound velocity. The data is presented as exported tab-delimited ASCII and archived at IMARDIS (portal.imardis.org/metadata/imardis:metadata:75f17942-827e-4ac9-a348-dc7358bfd1e9/downloads). A multi-beam image of the wreck is also shown.#
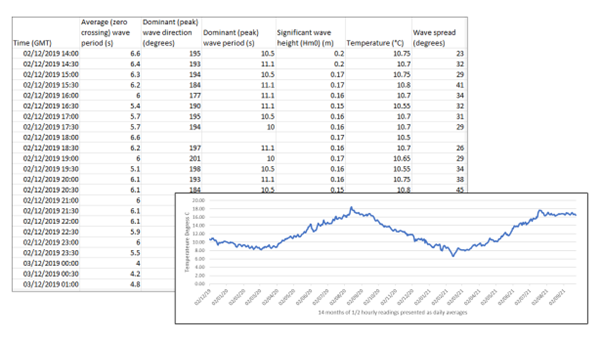
Fig. 6.4 Data structure of SEACAMS wave buoy deployed in Dales Roads from 2 December 2019 to 23 September 2021 downloaded as .xls file and processed in MS Excel to create a plot of annual sea temperatures © Bangor University.#