Sources of data
In undertaking any GIS-based work the most common sources of spatial data will comprise one or more of the following:
- mapsheets and plans
- raw co-ordinate lists, derived from field survey or extracted from existing site records such as those held within national and regional monument records
- aerial photographs and remotely sensed images
- digital data products, such as the United States Geological Survey topographical data.
Derived data
You will often be using data derived from other sources when creating or managing a GIS data set. There are often important considerations in documenting derived data sets, as discussed in Documenting data creation. When deriving data from another source, or when making use of derived data, it is the responsibility of the data user to ensure that any intellectual property rights belonging to the initial data creator(s) are respected. In some cases this may simply be a requirement to acknowledge the originating source, in other cases a royalty payment may be due for some part of the data to be used. Be sure to check out the situation in advance.
Maps and plans
Mapsheets comprise one of the most widely available and familiar sources of spatial data. In incorporating spatial data derived from mapsheets it is important to be aware of a number of issues. The first of these concern the map itself. The medium of the map itself is highly important. While maps originated on specially stable plastic films, such as mylar, are reasonably stable, paper maps can stretch and distort over time. In addition, where the map is a copy rather than an original a number of distortions may be present as a result of the specific copying process used. In general the following information should always be recorded:
- Publisher and copyright owner, which will often (but not always) be the same. For Ordnance Survey mapping, the copyright holder is the Crown.
- The map medium.
- Scale of source map, given as a ratio, and the original scale (where the source map is an enlargement or generalisation from another map).
- Name of the map and the map series (where appropriate).
- Claimed accuracy for any specific map components: map makers will often provide an estimated precision for contour lines or other sub-components of a map.
- All details of the map projection and co-ordinate system employed. This information is usually printed on the mapsheet or else should be sought from the map source.
Integrating map data
There are three methods for integrating map data into a GIS database and these are based upon two discrete techniques. Where information to be recorded is indicated, this should be considered as being in addition to the generic information required for all mapsheets, as described above.
Scanning
Paper mapping can be scanned, with a flatbed or drum scanner, to generate raster GIS data themes. Scanning devices vary considerably in accuracy and resolution, with flatbed and drum scanners normally providing a resolution between 100 and 1200 dots per inch (dpi). The more expensive drum scanners claim resolutions of between 3-5000 dpi. In all cases care should be taken to distinguish between the true optical resolution of a given scanner and that obtained through interpolation procedures. If scanned, then there is likely to be a single raster file data product.
There are a very wide variety of image formats for holding raster data (see the Raster Images guide), the majority of which are designed for photographic images and not spatially referenced data. Several GIS provide proprietary raster data structures and record spatial referencing information (e.g. IDRISI, Arc/Info GRID, SPANS raster, GRASS raster), they also provide tools for importing data from other common raster formats. The Tagged Interchange File Format (TIFF) graphics standard has also been extended to provide georeferencing and spatial data in a format called ‘GeoTIFF’. Details of the GeoTIFF standard, including the official specification of Geotiff 1.0 can be obtained from the Geotiff website[1].
It should be noted that the scanning process can result in some very large raster images and this can be compounded by the software used to integrate and study the raster layers which may require increased colour depth.
For products that have been generated by scanning paper originals, the following additional information to the core mapsheet data should be recorded for each raster file generated. It should be noted that to retrieve some of this information will involve careful checking of the respective hardware and software documentation:
- Details of the scanning device used, such as the make and model, software driver and version
- Parameters chosen in the scanning process, such as the resolution setting of the device, the number of bits per pixel used
- Details of any pre-processing undertaken on the source mapsheet. This may include a range of options provided by the specific scanning software used
- Details of any post-processing undertaken on the data, such as noise reduction or sharpening with convolution filters, histogram equalisation, contrast adjustment
Digitising
Maps and plans may also be geometrically described, using a digitising tablet, to provide vector data. Digitising tablets generally offer finite resolution in both x and y directions. This can be expressed as a quoted resolution, for example 0.02 inches or 0.001 inches, or as lines per inch (lpi), e.g. 200 lpi or 1000 lpi. This information can be found within the digitiser manual. Unlike the scanning process, where a scanned map generates a single raster GIS image, digitising a single paper map may form the basis of a large number of discrete, thematic vector data layers.
When digitising mapsheets the following additional information should be recorded. As with the scanning process this may involve careful checking of hardware and software documentation, for example to determine the resolution of the digitiser.
- Detail of the digitising device used, such as the make and model, software driver and version
- The precision, usually specified as a quoted resolution or as lpi
- Details of any automatic vector processing applied to the theme (such as snap-to-nearest-node)
- Details of control points used to manage conversion from digitiser to real-world planar co-ordinate systems
- Errors incurred in the above transformation process (e.g. quoted RMS)
Scanning-digitising hybrid
A third option is to scan the source document but then use the scanned product as the basis for ‘on screen digitising’, using a graphics workstation and pointing device to create vector data themes. This is often referred to as ‘heads-up digitising’ and is an attractive option where a digitising tablet is not available, or where raster data from a third party can be obtained.
The basis of heads-up digitising is to use the mouse pointer to trace around the image to be digitised, recording the coordinates as it moves – in much the same manner as moving the puck on a digitising table or tablet. With the image displayed on the computer screen, however, it is easy to zoom in on an area of complexity in a way that is hardly possible on the digitising table or tablet. Indeed, with the scanned image, the only limit to this enlargement is the point at which the individual cells, representing the marks on the original, are distinguishable as squares and rectangles. Where the scan is at 300 pixels per inch, typical of many desktop scanners, each of these cells represents approximately 0.085mm square; with higher resolution scanners the size of these cells is proportionately smaller! In addition to this facility, because registration is effectively performed when the map/plan is scanned, it is much easier to undertake the digitisation in much smaller time-chunks, thus minimising errors resulting from fatigue, etc.
There are a number of software tools available to assist in obtaining vector data from a scanned image of a map or plan. These include very sophisticated, semi-automatic, tracing tools which, for an ideal image, can often vectorise perhaps 70-80% of the data without intervention and which automatically request intervention when a problem cannot be resolved. Examples of this type of tool include Vtrack, from Laserscan, and ArcScan, from ESRI. Tools such as these can manipulate output from high (over 3000 pixels per inch) resolution drum scanners, as well as the output from a desktop flatbed scanner. Such software tends to be expensive, although sometimes available to non-profit research and educational institutions at discounted rates. There are also, at the other end of the price/sophistication range a number of cheap/shareware tools for running on a PC. These may have limitations in terms of the maximum scan resolution they can handle, or the maximum size or complexity of the image. Note that none of these tools can be guaranteed to be able to vectorise 100% of a scanned map/plan without intervention. The degree of intervention required will always be a function of the sophistication of the vectorising/tracing tool, the quality of the scan, and the nature of the original.
Textual and numeric data
Often spatial data will be encoded in the form of co-ordinate lists, for example those commonly found within regional and national monument registers. Where co-ordinates are expressed they should conform to the standard Surveying notation of Easting, Northing, elevation (x, y, z) though this may not be consistently applied in proprietary systems and particularly in hand-written records.
It is important to determine how the co-ordinates were derived, for example are they reckoned from a base-map or determined through field survey? In addition, it is also important to determine the precision of the co-ordinates as quoted. For example, within regional monument registers in the UK it is not uncommon to find the locations of archaeological sites quoted to the nearest 100 metres (what is referred to as a 6 figure grid reference). If this data is to be integrated into a GIS database comprising spatial data originated at one metre resolution, these co-ordinates will have to be rounded up, leading to a spurious level of accuracy.
One important point to realise when using co-ordinate references is that even when a discrete point reference is quoted it is in actuality indicating the lower left-hand corner of a bounding box. The size of this bounding box is dictated by the resolution of the reference. To return to the example of a UK sites and monuments register, far from indicating the precise location of a site on the ground, the six figure reference actually serves to locate the bottom left-hand corner of a 100 x 100 metre bounding box, somewhere within which the site is located.
Integrating textual and numeric data
When integrating textual and numeric data it is important to understand the co-ordinate system to which the quoted co-ordinate locations relate. Although co-ordinates will most commonly reference a national or international system, such as the Great Britain National Grid, or UTM, occasionally they may relate to a site-grid. This is a contingent rectangular co-ordinate system with its datum at a fixed point, that has been established for a specific purpose. Perhaps the most common examples are geophysical survey grids and excavation grids, established to facilitate the spatial recording of features within excavated contexts. Until the location of grids has been surveyed or ‘fixed’ with respect to a larger or more generic co-ordinate system, such as those mentioned above, it can be thought of as ‘divorced’ or ‘floating’ and whilst internally consistent is impossible to relate it spatially to features beyond the confines of the grid. Needless to say, the geo-referencing status of grids must carefully be considered when archiving data for potential future re-use as this can seriously affect the overall accuracy of the quoted co-ordinates. For a detailed discussion of these issues undertaken in the context of geophysical survey, practitioners are referred to the guide on Geophysical Data in Archaeology.
When integrating textual and numeric data the following information should be recorded:
- The data source
- The precision of the quoted co-ordinates
- Have the quoted locations been verified and how?
- Projection system/co-ordinate origin
- If derived from a source map, where possible record details of the map-base used (see the paragraph on map data for details of the information required)
- If derived from a survey programme, where possible record details of the survey procedure (see the paragraph on Survey data for details of the information required)
Purchased or downloaded digital data
Spatial data which is already in digital form may be purchased from mapping agencies (such as the Ordnance Survey or public utilities). Many agencies supply both raster and vector data, depending on the requirements of the user. An increasing amount of spatial information can also be downloaded from the Internet, again in both vector and raster formats.
A Note on the Integration of digital data sources
Looking to the information that it is important to record, it must be realised that such data is often derived from another medium, for example a scanned or digitised map or a scanned image of a geophysical survey. As a result, similar information to that required for these data sources should also be recorded for digital data products. This information will be obtainable directly from the supplier and should be requested if not supplied.
As discussed previously, vector data may take the form of simple points or lines, often with associated attributes, or more complex topological themes such as arc-node data. Because of the variety of data structures used in different GIS, particularly for arc-node data, there is currently no platform-independent standard file format for spatial data. Several standard formats are of interest, however, and may be used in particular circumstances.
- British Standard 7567 (the National Transfer Format) is the format used by Ordnance Survey for the supply and transfer of digital products. It allows both spatially referenced raster and vector products to be stored in ASCII coded form. A useful guide to the OS implementation of BS 7567 (NTF 2.0) may be obtained from the Ordnance Survey
- Users and those involved in the archiving of spatial vector and raster data in the United Kingdom should also be aware of the National Geospatial Data Framework (NGDF), which is “a national forum of data providers and data users seeking to facilitate and encourage widespread use of geospatial data which is ‘fit for purpose’. Its objectives are to facilitate and encourage collaboration in the collection, provision and use of geospatial data; to facilitate and encourage the use of standards and best practice in the collection, provision and use of geospatial data and to facilitate and widen access to geospatial data”
- SDTS (Spatial Data Transfer Standard) is a United States Federal Information Processing Standard (FIPS) which was developed to accommodate different data models to allow users to encode spatial data in a standard format, accompany data with description and provide machine and platform independence. SDTS is the responsibility of the Federal Geographic Data Committee (FGDC). SDTS is not an exchange format for data, rather it is a standard set of guidelines which will describe and preserve a database design and its underlying model.
- DLG (Digital Line Graph) format is used by the United States Geologic Survey for supply of vector information, while DRG (Digital Raster Graphics) is the description that the USGS gives for the distribution of scanned map sheets. Details of these standards may be obtained from the USGS WWW site.
- DXF (Digital eXchange Format) format is commonly used for transferring drawings between Computer Aided Design systems. It is also however very widely (mis)used as a de facto standard for the transfer of digital spatial data (Walker 1993). A detailed discussion of DXF is undertaken in the CAD Guide to Good Practice.
Aerial photography
Aerial photographs may reveal archaeological sites directly, where they are extant, or as crop, soil or other surface indications where the site is buried. As a result, archaeology has a long history of using aerial photographs for recording existing site morphology, and prospecting for new ones.
Two types of aerial photograph are widely used in archaeology: vertical photographs and oblique photographs. In either case, the image will pass through at least two stages before it can be included in a GIS database i.e. it will need to be first rectified and then georeferenced. For a detailed bibliography and for a full and comprehensive discussion of the issues and techniques involved, including more advanced techniques such as photogrammetry, please refer to the guide on Aerial Survey for Archaeology.
To incorporate scanned and rectified aerial photographs into GIS databases the following information should be recorded:
- Full Photographic details
- Details of the scanning process if employed (see the paragraph on map scanning for details of the information that should be recorded)
- Details of the rectification method(s) used
- The software employed including, where possible, specific parameters chosen
- Details regarding the ground control points (GCPs) used during the procedure
- Details of any post-processing undertaken on the data, such as noise reduction or sharpening with convolution filters, histogram equalisation, contrast adjustment etc.
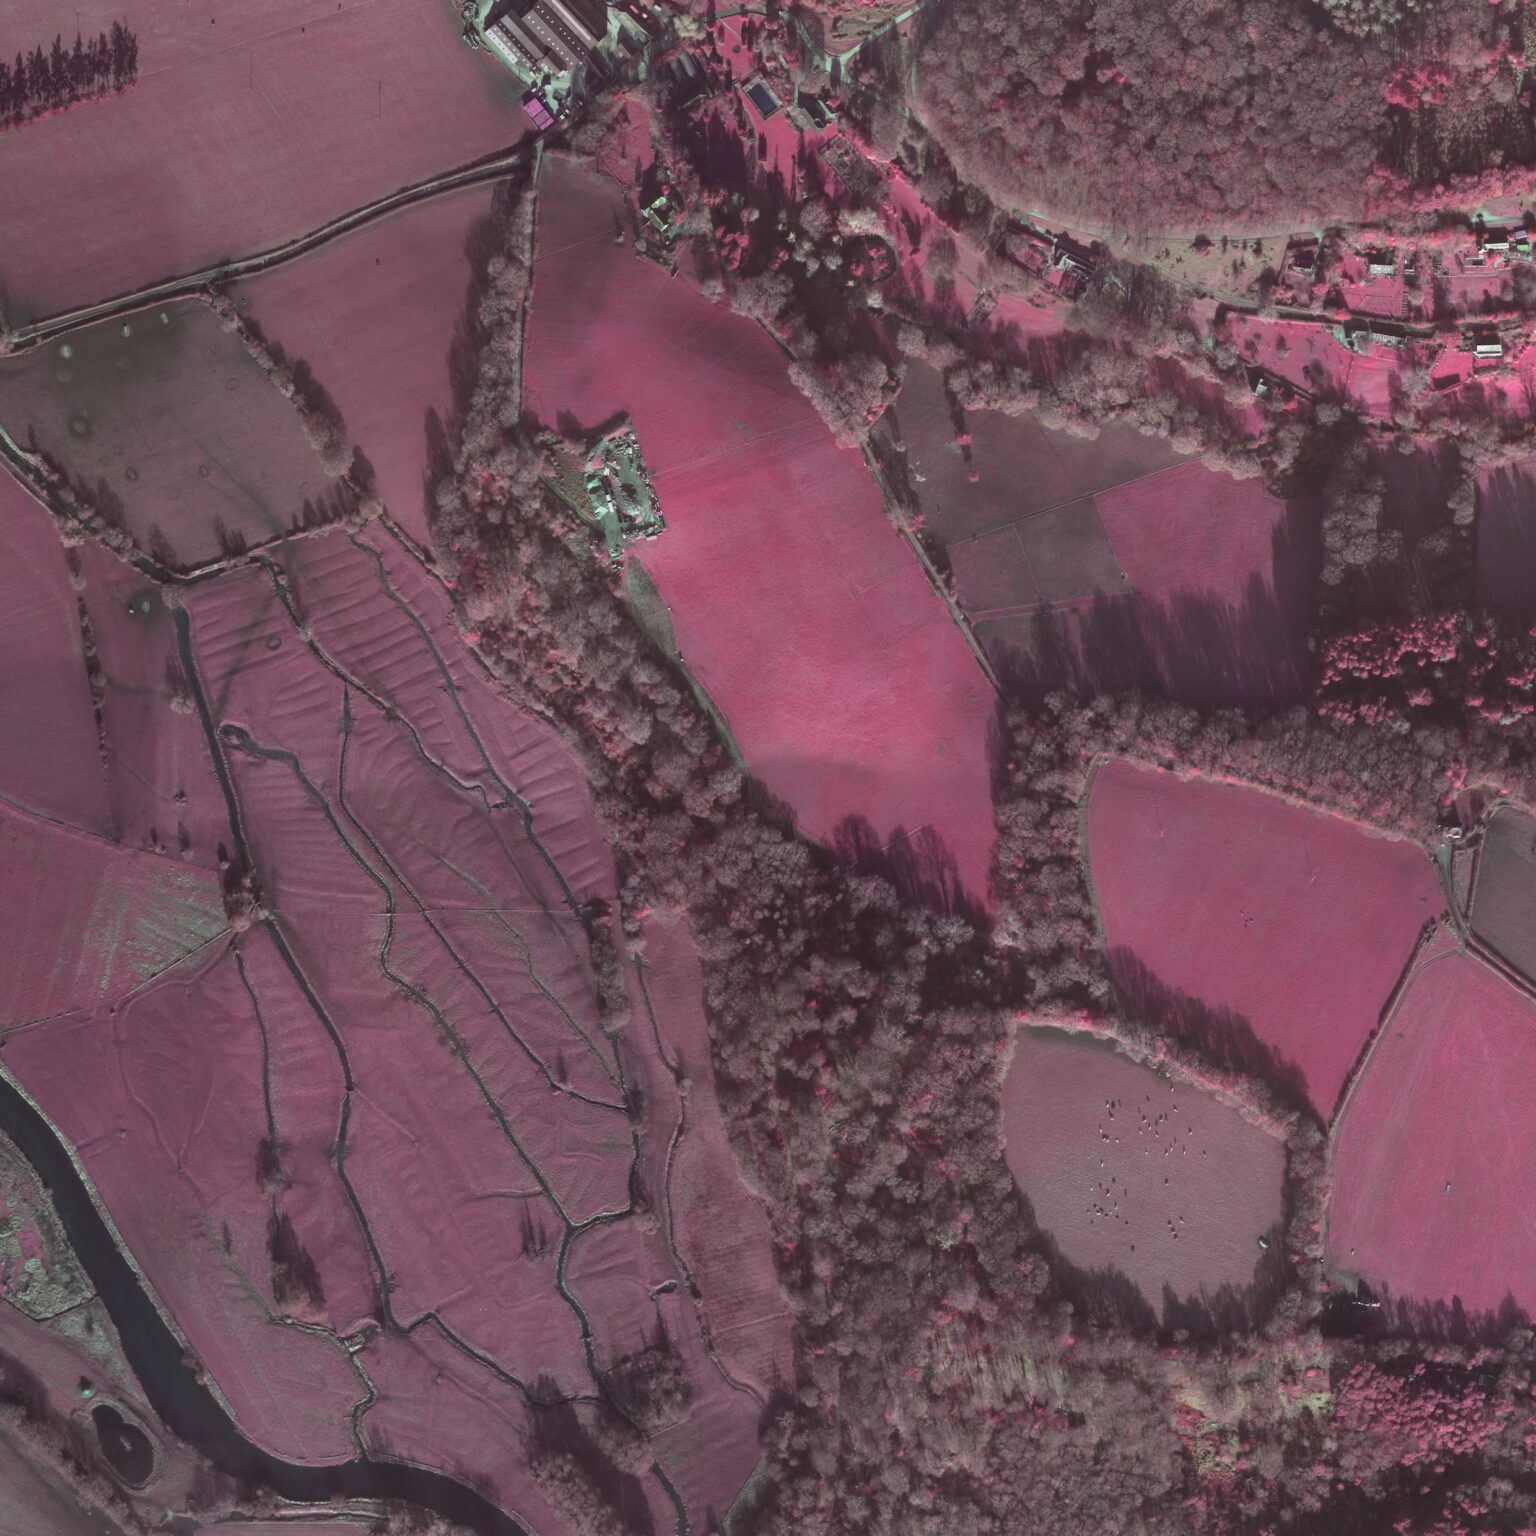
Satellite and airborne remote sensed images
Airborne remote sensing refers to situations in which an aircraft carries an electronic sensor that records information directly to digital format. In recent years, increasing use of remote sensing satellites has been made with images being available at reasonable cost. For a detailed bibliography and for a full and comprehensive discussion of the issues and techniques involved please refer to the guide on Aerial Survey for Archaeology.
Looking to the information that needs to be recorded, many of the issues which arise when using scanned aerial photography will also be relevant to the integration of airborne remote sensed data. For example, they will normally require rectification in the same way as scanned photographic material. Once again, comprehensive details can be found in the guide on Aerial Survey for Archaeology.
- Data source
- Date image was captured
- Data resolution
- Details of any post-processing undertaken on the data, such as noise reduction or sharpening with convolution filters, histogram equalisation, contrast adjustment etc.
- Details of the rectification method(s) used
- The software employed including, where possible, specific parameters chosen
- Details regarding the ground control points (GCPs) used during the procedure
Primary survey data
Terrestrial survey
Data from older optical instruments will normally have been recorded and even processed entirely by hand. Most modern total-station and satellite-based instruments (using either US ‘Navstar’ Global Positioning System (GPS) or the Russian GLONASS) have internal data stores and processors, or are used with a separate data logging device, typically a hand-held or laptop computer.
Data may be obtained directly from these survey instruments, usually in the form of co-ordinate pairs (or 3D triples) often with attached attribute(s). It may be exported either to proprietary data file formats, or to ASCII files which can be imported directly to GIS databases. In many cases, there is unlikely to be a complex thematic arrangement of data, although this is changing with the increasing use of advanced data logging software that provides direct GIS or CAD input in the field.
Commonly, however, survey data will be in the form of CAD drawings, which may have thematic (layer) structure or complex block-attribute structure themselves. Here, the source and derivation of the data used to construct each layer must be documented. Readers should consult the CAD Guide to Good Practice to familiarise themselves with CAD systems.
Whatever the source of the data, it is essential to understand the sources of errors and to record details of any instruments, software and methods used to derive the co-ordinates used in GIS layers. Whilst modern semi-automated survey instruments and methods may be easier to use and reduce the possibility of simple transcription and mis-calculation errors, they are still subject to many sources of error. For terrestrial survey methods, these include the reliability of locations used as survey base stations as well as individual and cumulative measurement errors introduced by the instrument and its operators (Clancy 1991).
Integrating terrestrial survey data
Survey information may well be in the form of angle and distance measurements. Although there are GIS which can store and manipulate such geometric measurements, they are most often processed to derive Cartesian co-ordinates. Much in the same way as for quoted co-ordinate lists and textual data, when incorporating terrestrial survey data into a GIS database it is critically important to understand fully the co-ordinate system to which the quoted co-ordinate locations relate. Most surveys begin their lives divorced or floating, i.e. quoting co-ordinates with respect to a highly contingent rectangular co-ordinate system. These divorced surveys are internally consistent and commonly employ very precise technology, for example total-station survey instruments, capable of recording locations to the nearest millimetre and beyond. Before the results of such surveys can be more widely employed they have, however, to be integrated within a larger or more generic co-ordinate system, such as a national survey grid or UTM. Despite the high precision of such surveys, this process of geo-referencing can severely affect the overall accuracy as often the divorced survey grid is ‘fixed’ with respect to points derived from base-maps which themselves may only, at best, have been located to the nearest metre. The more accurate the points utilised to fix the divorced survey grid within a larger co-ordinate system, for example the use of triangulation pillars or high precision GPS, the greater the accuracy of the resultant survey data resource.
When integrating data themes which are derived from survey data, the following should be recorded:
- The source (paper/digital map, GPS, data from mapping agency) and estimated error of survey base station co-ordinates
- Details of the survey, including date time and purpose
- Details of the thematic organisation of the survey
- Make and model of instrument used
- Type of survey (contour, feature etc.)
- Estimated error terms for the co-ordinate pairs and (if appropriate) the z-co-ordinate
- Georeferencing information, overall accuracy of the survey data
Satellite-based (GPS) Survey
Satellite-based survey data is complicated by the variety of possible methods used by receivers to produce a position fix, and by differential techniques used to improve the accuracy of fixes. Whilst a single fix from a simple hand-held device intended for navigational purposes may only be accurate to within 100m, differential correction may improve this to 10-15m, or better. On the other hand, under favourable circumstances, the best survey instruments may achieve sub-centimetre accuracy.
The accuracy of fixes from the same equipment varies through time as the relative positions of satellites and receiver change. Careful ‘mission planning’ is essential to avoid times when the satellites offer a poor configuration for triangulation or when a reduced number of satellites are visible from the observation site. Fortunately, many data logging packages include satellite prediction facilities that can be used to determine the optimum observation times. Jan van Sickle (1996) and David Wells (1986) provide useful introductions to satellite surveying, whilst Leick (1995) gives a thorough coverage of the underlying technology and mathematics.
Integrating GPS data
As discussed earlier, satellite systems measure the relative positions of receiver and satellites using an ECEF Cartesian co-ordinate system. Whilst positions expressed in ECEF x,y,z co-ordinates are ideal for locating satellites and receivers in 3D space, they are rather less suitable for terrestrial mapping. Fortunately, most receivers will output co-ordinates expressed in latitude and longitude relative to the WGS 84 ellipsoid, and many will also generate positions relative to other ellipsoids and in other co-ordinate systems such as UTM or the various national grids. If the only co-ordinates available are relative to WGS 84 or some other system, these will require transformation to the system used for the base mapping in the GIS. This conversion requires both a transformation between ellipsoids and a datum shift. Numerous datums have been used for mapping around the world. For details, see Snyder (1987; 1989). Each datum is defined in terms of a common reference ellipsoid together with x,y,z offsets that take account of differences in the origins of the ellipsoids and local deviations of the earth’s surface from the ideal ellipsoid.
For mapping in the UK, the Ordnance Survey publishes two booklets (1995; 1996) giving details of transformations between ECEF, WGS 84, Latitude/Longitude, and the National Grid. Similar transformations are used to derive UTM co-ordinates.
Some GIS provide suitable datum transformation functions and several purpose-written programs are also available for this task. It is important to realise, however, that the results produced by many transformation methods are only approximations that may degrade the accuracy of the original position. For example, the methods described in Ordnance Survey (1996) produce National Grid co-ordinates that are only correct to within 2 metres. The programs and methods used in any transformation must therefore be recorded as part of the history of the data.
In integrating satellite data the following information should be recorded:
- The method used to locate stations: C/A or P code pseudorange measurements, carrier phase measurements and whether a single measurement or averaging (include time period) was used
- The software used for any co-ordinate transformation and associated error estimate
- The satellites used in obtaining fix and observed GDOP (Geometric Dilution of Precision, a measure of the quality of the fix indicating the suitability of satellite positions for triangulation)
- The nature of any differential correction undertaken together with error estimates
- The broadcast differential: name of the service provider and the name and location of base station
- The local base station: instrument details, location (including error estimate) of base station
- Post-processing: the software used and the source of correction data
Preferred and accepted formats for GPS data
GPS or GLONASS data will often have been recorded using data logging equipment and then transferred to other systems using a simple ASCII text, DXF or proprietary GIS or CAD format. For most purposes, one of these formats, particularly if it includes associated attribute data, will be preferred.
The direct output of many of these receivers is usually in one of the following formats:
- NMEA 0183: an ASCII protocol devised by the US National Maritime Electronics Association for marine navigation equipment (NMEA 1995)
- RINEX version 2: Receiver INdependent EXchange format (Gurtner and Mader 1990; Gurtner 1994)
- A proprietary ASCII or binary format such as Trimble Standard Interface Protocol (TSIP)
Of these, RINEX is widely used and is not tied to a particular device or class of device. It also has a provision for recording comments and events, such as movement to a new survey point and the start of a new point occupation. Where raw satellite data forms part of a data set, it is the currently preferred format.