Case study 4: Modelling the older Propylon in Athens
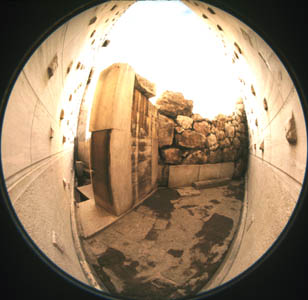
The survey of the older propylon to the Acropolis in Athens (the predecessor to the Propylaea, the classical building standing at the entrance today) began in 1975. CAD has been used on this project since 1986, with a number of different CAD techniques and programs being explored.

When survey work began in 1975 it was carried out with traditional measuring devices (levels, plumb bobs, tapes, carpenter’s squares, etc.) and a series of elevations was taken with a transit (known as a level in the UK). It was clear from the outset that certain of the blocks were not vertical and, as a result, measurements of the inclinations of their surfaces were taken with a tape measure and plumb bob. Had those measurements not been taken, the construction of an accurate three-dimensional model would not have been possible.
Modelling work began in 1986 with a CAD program called CADDraft. A fully three-dimensional model was made with ARRIS, the first fully three-dimensional CAD program available for PCs, and it ran on Xenix, a Unix variant. The model was later re-created with AutoCAD, although many other programs were tried prior to this.
The survey data could not be entered as simple x-, y-, z-coordinates. Measurements were always taken from some specified point or points in the structure to the one in question. As a result, new points always had to be defined in terms of other points in the model, not known locations in a Cartesian grid system; locating the points in the modelling process required relating a new point to one or more old ones. In some programs that was very easy but others proved more difficult to use either because they forced the use of the mouse or because only minimal tools were provided for specifying geometry from the keyboard.
When the model reached an advanced state, interpretation suggested that the rough fortification wall behind the propylon had been moved by tectonic forces and so the stones were surveyed. A desktop photogrammetry program called MR2 was used and this information made it possible to finish the model (Eiteljorg 1990).
When AutoCAD R12 was released connections between the model and a database became possible. This enabled each in situ object to be linked to a table containing information about the material, date of erection and demolition, number of such blocks, etc. All objects were also linked to a table defining the layer names and their meaning, e.g. that a stone was in situ but in a secondary use setting.
Illustrations were prepared for publication (Eiteljorg 1993). These were made by exporting AutoCAD drawings to Adobe Illustrator where text and shading was added. The illustrations were then printed on film for direct inclusion in the printing plates. The CAD model has also been made available on-line by the Center for the Study of Architecture/Archaeological Data Archive[1].


